RSI OBOS
RSI OBOS Indicator for MetaTrader (MT4)
What is the RSI OBOS Indicator?
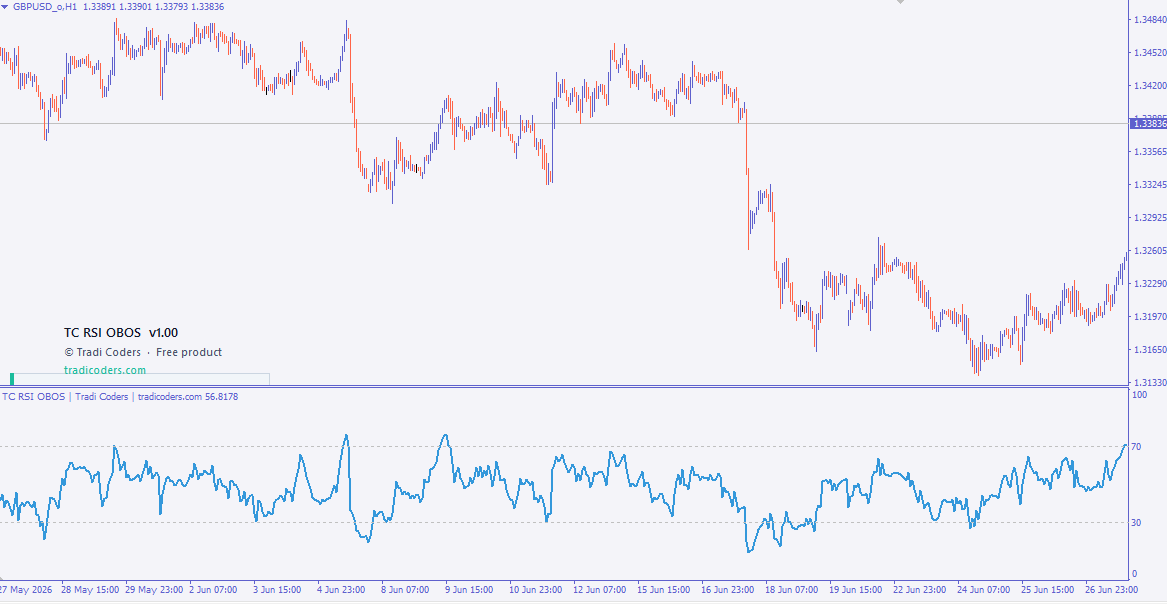
The RSI OBOS Indicator is a professional momentum-based technical analysis tool that automatically identifies Overbought (OB) and Oversold (OS) market conditions using the Relative Strength Index (RSI). It is designed to help traders recognize potential market reversal zones by measuring the strength and momentum of price movements before significant trend changes occur.
As one of the most widely used momentum indicators in technical analysis, the RSI enables traders to determine when buying or selling pressure has reached extreme levels. By automatically highlighting these conditions, the RSI OBOS Indicator eliminates the need for manual RSI analysis and provides clear visual references that help traders make faster and more informed trading decisions.
Whether you trade Forex, Stocks, Commodities, Indices, or Cryptocurrencies, the RSI OBOS Indicator can be an effective addition to your trading strategy by identifying potential buying and selling opportunities across all financial markets.
How Does the RSI OBOS Indicator Work?
The indicator continuously calculates the Relative Strength Index and stores its internal data using the following buffers:
double ExtRSI[];
double ExtOS[];
double ExtOB[];
ExtRSI[]
This buffer stores the calculated Relative Strength Index (RSI) values.
The RSI measures market momentum by comparing the average gains and losses over a selected period, producing values between 0 and 100. These values help traders evaluate whether bullish or bearish momentum is strengthening or weakening.
Generally:
-
RSI values above 70 indicate strong buying momentum.
-
RSI values below 30 indicate strong selling momentum.
-
Momentum changes often occur before price reversals become visible on the chart.
The RSI serves as the foundation for detecting overbought and oversold market conditions.
ExtOB[]
This buffer identifies Overbought (OB) conditions.
An overbought condition occurs when the RSI rises above the predefined upper threshold, indicating that buying pressure has become exceptionally strong. While this does not guarantee an immediate reversal, it often signals that the current upward movement may be losing momentum.
The indicator highlights these areas to help traders identify potential:
-
Market tops
-
Bearish corrections
-
Trend exhaustion
-
Sell opportunities
-
Profit-taking zones
Professional traders frequently combine overbought signals with price action analysis, resistance levels, or candlestick confirmation before opening short positions.
ExtOS[]
This buffer identifies Oversold (OS) conditions.
An oversold condition occurs when the RSI falls below the predefined lower threshold, suggesting that selling pressure has reached an extreme level. This may indicate that bearish momentum is weakening and that buyers could begin entering the market.
The indicator highlights these areas to help traders identify potential:
-
Market bottoms
-
Bullish reversals
-
Buy opportunities
-
Trend recovery
-
Long trade setups
Oversold signals are often used alongside support levels and bullish confirmation patterns to improve trading accuracy.
Understanding Overbought and Oversold Conditions
Overbought Market
An overbought market suggests that price has risen rapidly and buying momentum may be approaching exhaustion.
Typical characteristics include:
-
Strong bullish movement
-
RSI above the overbought level
-
Potential market correction
-
Possible bearish reversal
Although markets can remain overbought during strong trends, these conditions often encourage traders to monitor the market for potential selling opportunities.
Oversold Market
An oversold market suggests that price has declined significantly and selling momentum may be weakening.
Typical characteristics include:
-
Strong bearish movement
-
RSI below the oversold level
-
Potential market recovery
-
Possible bullish reversal
Oversold conditions often provide traders with valuable opportunities to prepare for potential buying setups when additional confirmation is present.
Main Benefits of the RSI OBOS Indicator
Automatic Overbought & Oversold Detection
The indicator automatically identifies momentum extremes, allowing traders to recognize important market conditions without manually monitoring RSI values.
Improves Market Timing
By highlighting potential reversal zones, the indicator helps traders improve entry and exit timing while reducing uncertainty during market analysis.
Eliminates Manual RSI Analysis
Instead of constantly watching the RSI oscillator, traders receive clear visual indications whenever the market reaches significant momentum extremes.
Works on Any Financial Market
Suitable for:
-
Forex Trading
-
Cryptocurrency Trading
-
Stock Trading
-
Gold Trading
-
Commodity Trading
-
Index Trading
Compatible with All Timeframes
The RSI OBOS Indicator performs effectively across multiple trading styles, including:
-
M1
-
M5
-
M15
-
M30
-
H1
-
H4
-
Daily
-
Weekly
Trading Advantages
Using the RSI OBOS Indicator can help traders:
✔ Detect overbought market conditions automatically.
✔ Identify oversold trading opportunities.
✔ Recognize potential trend reversals earlier.
✔ Improve trade entry and exit timing.
✔ Reduce emotional decision-making.
✔ Increase confidence through momentum analysis.
✔ Enhance technical analysis efficiency.
✔ Combine momentum signals with other trading strategies.
Conclusion
The RSI OBOS Indicator is a professional MetaTrader 4 (MT4) momentum indicator that automatically identifies overbought and oversold market conditions using the Relative Strength Index (RSI). Through its internal calculation buffers (ExtRSI, ExtOB, and ExtOS), the indicator continuously monitors market momentum and highlights potential reversal zones where buying or selling pressure may be reaching an extreme.
By combining automatic momentum analysis with clear visual signals, the RSI OBOS Indicator helps traders identify high-probability trading opportunities while reducing the need for manual chart analysis. Whether used as a standalone momentum indicator or alongside support and resistance, price action, and trend-following strategies, it provides a reliable and efficient solution for improving technical analysis across Forex, Stocks, Commodities, Indices, and Cryptocurrency markets.
No screenshots available for this product.
No comments yet. Be the first to share your feedback.
Leave a Comment
Related Products
More Indicator tools you may like.

Session Scanner
MA Crossover
MACD Crossover
RSI Divergence