MACD Crossover
MACD Crossover Indicator
The MACD Crossover is a popular technical analysis indicator designed to help traders identify potential trend changes, momentum shifts, and trading opportunities in financial markets. Based on the well-known Moving Average Convergence Divergence (MACD) methodology, this indicator analyzes the relationship between two moving averages and generates buy or sell signals when significant crossover events occur.
How the MACD Indicator Works
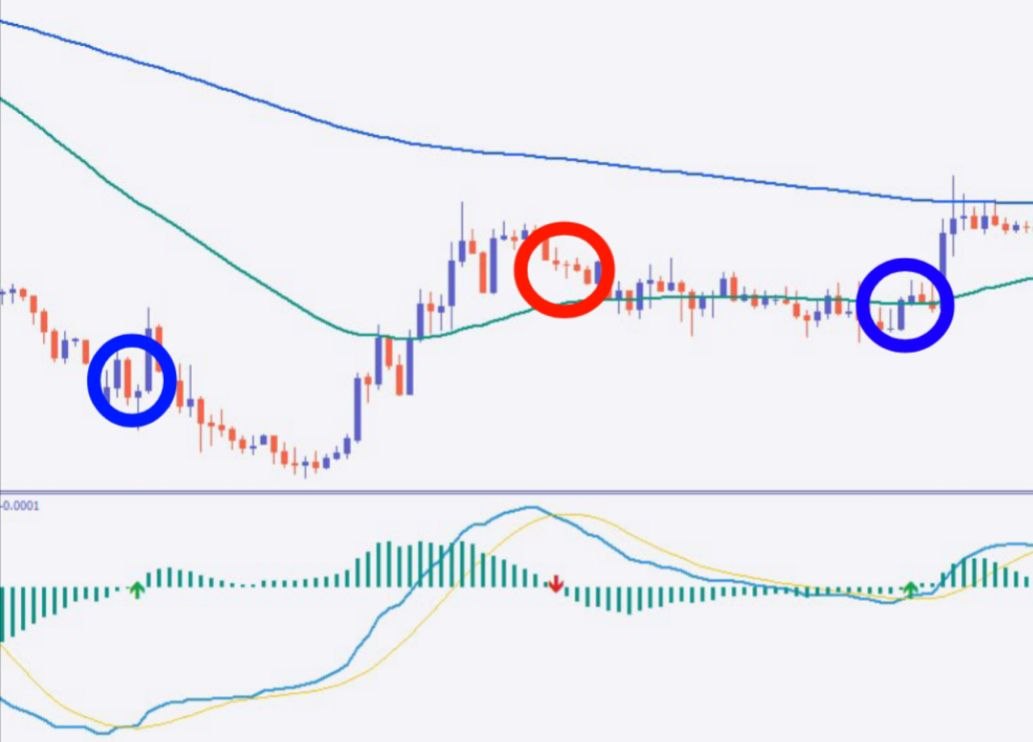
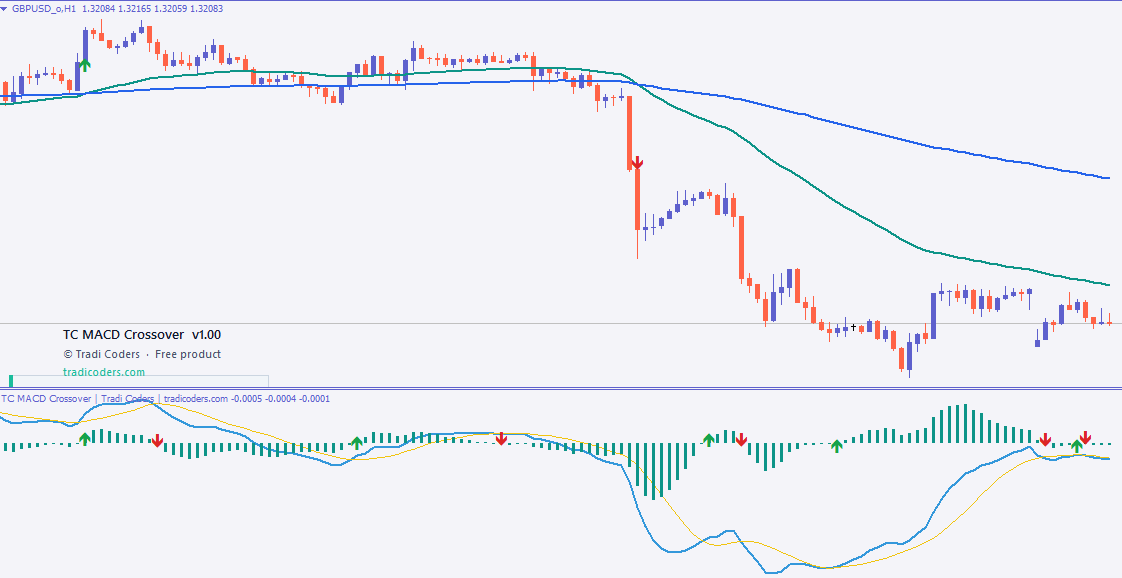
The MACD (Moving Average Convergence Divergence) measures the difference between a fast-moving exponential moving average (EMA) and a slower EMA. This difference forms the MACD line, which is then compared against a Signal line (another EMA of the MACD line). When these two lines cross, they can indicate potential bullish or bearish market momentum.
Bullish Crossover: Occurs when the MACD line crosses above the Signal line, suggesting increasing upward momentum and a potential buying opportunity.
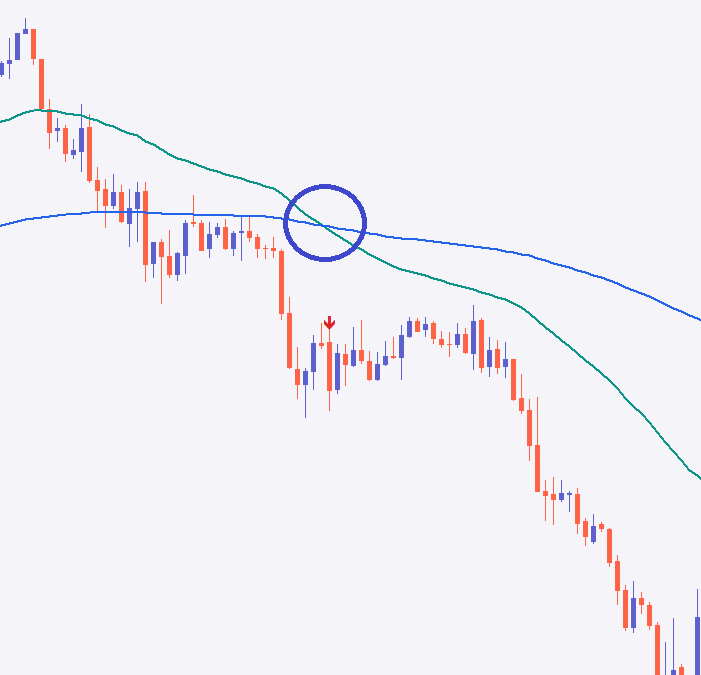
Bearish Crossover: Occurs when the MACD line crosses below the Signal line, indicating weakening momentum and a potential selling opportunity.
Histogram Analysis: The histogram visually displays the distance between the MACD line and the Signal line, helping traders assess momentum strength and trend acceleration.
Indicator Components
The MACD Crossover indicator utilizes the following core data arrays:
ExtMACD[] – Stores the calculated MACD values representing the difference between the fast and slow exponential moving averages.
ExtSignal[] – Stores the Signal Line values, which smooth the MACD line and provide crossover confirmation.
ExtHist[] – Stores Histogram values, displaying the difference between the MACD and Signal lines to visualize momentum strength.
ExtBuy[] – Generates and stores bullish crossover signals when the MACD line crosses above the Signal line.
ExtSell[] – Generates and stores bearish crossover signals when the MACD line crosses below the Signal line.
Key Features
Real-time MACD crossover detection.
Clear buy and sell signal generation.
Histogram-based momentum visualization.
Suitable for forex, stocks, indices, commodities, and cryptocurrency markets.
Easy integration into automated trading systems and discretionary trading strategies.
Compatible with trend-following and momentum-based trading approaches.
Trading Applications
Traders commonly use the MACD Crossover indicator to identify trend reversals, confirm existing trends, and improve trade timing. By combining MACD crossover signals with support and resistance levels, price action analysis, or other technical indicators, traders can enhance decision-making and reduce false signals.
No comments yet. Be the first to share your feedback.
Leave a Comment
Related Products
More Indicator tools you may like.
Session Scanner