RSI Divergence
How Does the RSI Divergence Indicator Work?
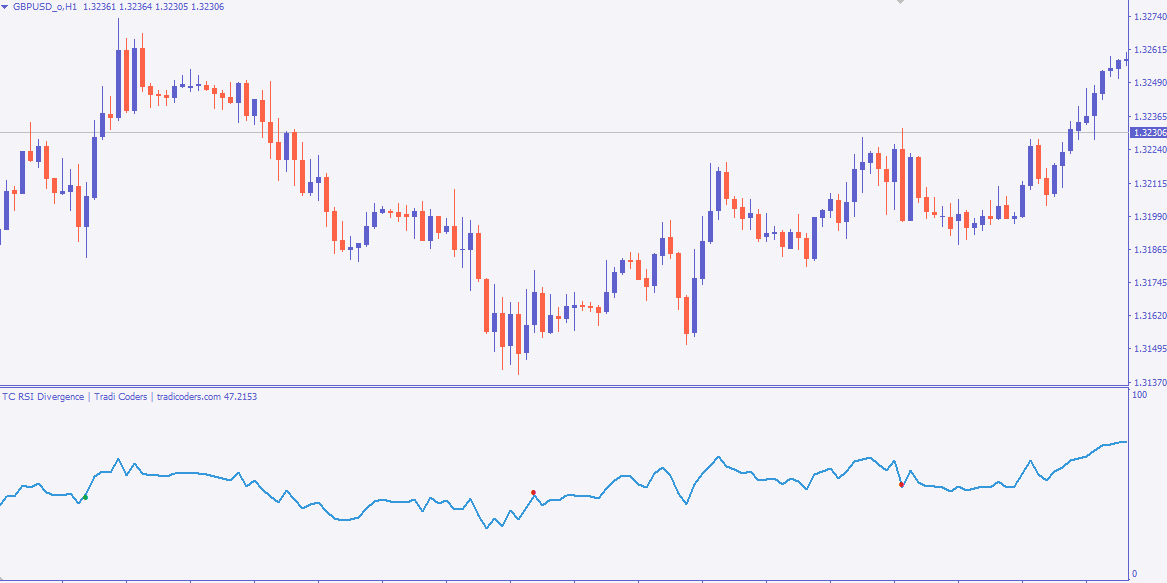
The indicator calculates the RSI value for each candle and stores the data internally using:
double ExtRSI[];
double ExtBull[];
double ExtBear[];
ExtRSI[]
This buffer stores the calculated Relative Strength Index (RSI) values.
The RSI measures market momentum by comparing recent gains and losses over a selected period. RSI values typically range between 0 and 100:
- RSI above 70 may indicate overbought conditions.
- RSI below 30 may indicate oversold conditions.
- RSI momentum changes often appear before price reversals.
The indicator uses this RSI data as the foundation for divergence detection.
ExtBull[]
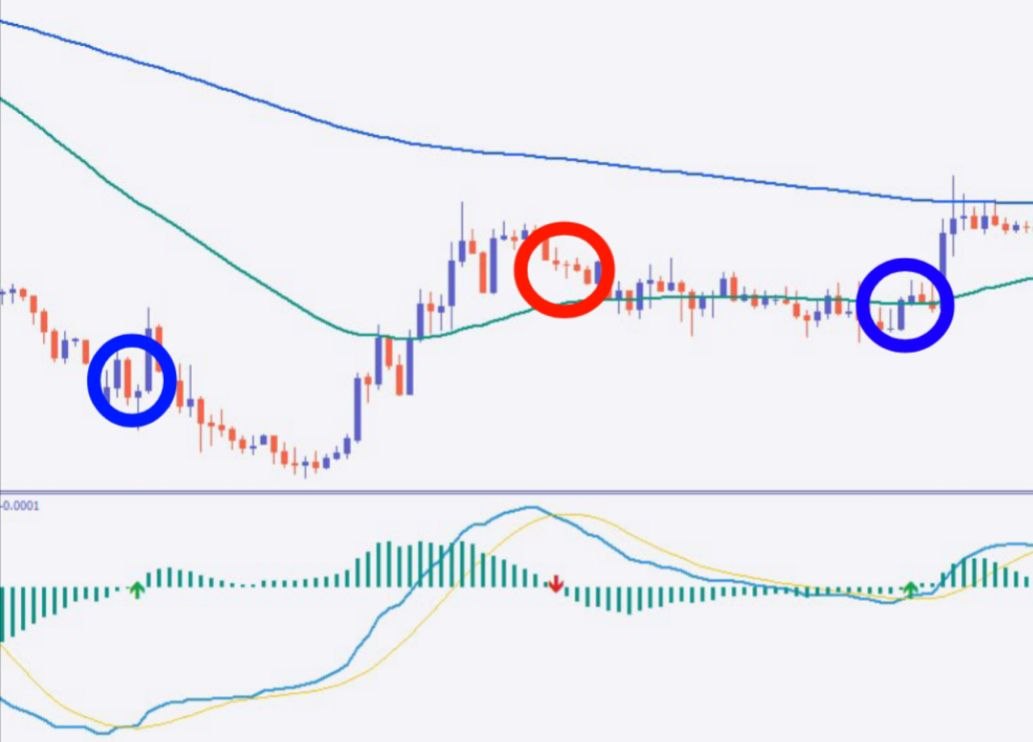
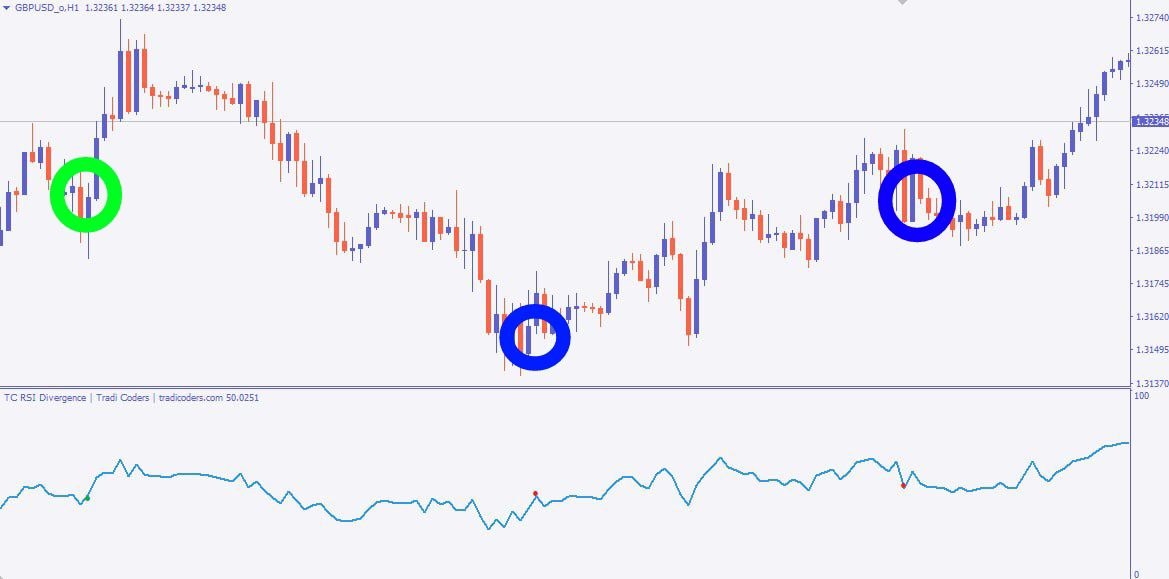
This buffer stores detected Bullish Divergence Signals.
A bullish divergence occurs when:
- Price creates a lower low.
- RSI creates a higher low.
This indicates that selling pressure is weakening even though price continues moving downward.
The indicator marks these opportunities on the chart to help traders identify potential:
- Trend reversals
- Market bottoms
- Buy opportunities
- Long trade setups
Bullish divergence is often considered an early warning signal that buyers may soon gain control of the market.
ExtBear[]
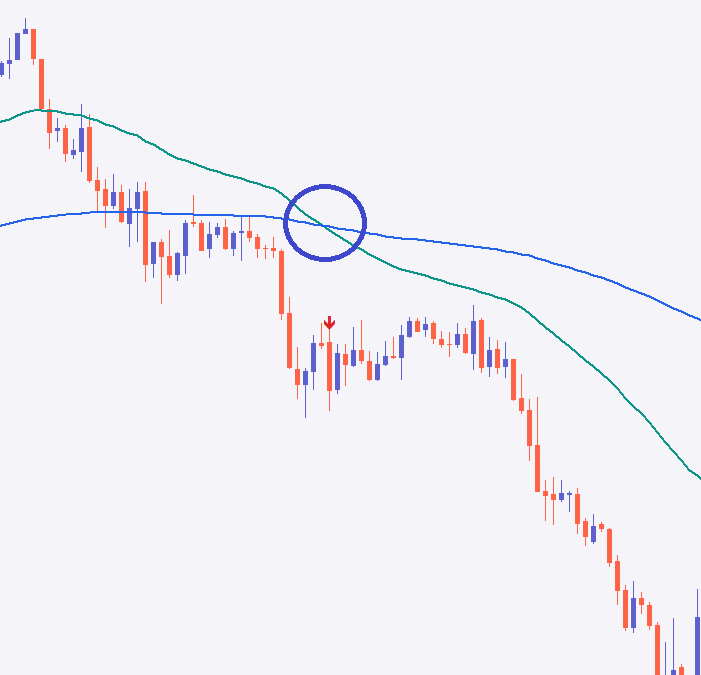
This buffer stores detected Bearish Divergence Signals.
A bearish divergence occurs when:
- Price creates a higher high.
- RSI creates a lower high.
This indicates that buying momentum is weakening despite the market continuing to push higher.
The indicator identifies these situations and marks potential:
- Trend reversals
- Market tops
- Sell opportunities
- Short trade setups
Bearish divergence frequently appears before significant downward corrections or trend reversals.
Types of Divergences Detected
Bullish Divergence
A bullish divergence suggests that bearish momentum is fading.
Example:
- Market creates a new lower low.
- RSI fails to create a new lower low.
- Buyers begin entering the market.
Potential result:
- Price reversal upward.
- Strong buying opportunity.
Bearish Divergence
A bearish divergence suggests that bullish momentum is fading.
Example:
- Market creates a new higher high.
- RSI fails to create a new higher high.
- Sellers begin entering the market.
Potential result:
- Price reversal downward.
- Potential selling opportunity.
Main Benefits of the RSI Divergence Indicator
Early Trend Reversal Detection
The indicator can identify potential market turning points before the majority of traders notice them.
Eliminates Manual Analysis
Instead of manually comparing RSI and price movements, the indicator automatically scans the chart and highlights valid divergence setups.
Works on Any Market
Suitable for:
- Forex Trading
- Cryptocurrency Trading
- Stock Trading
- Gold Trading
- Index Trading
- Commodity Trading
Works on Any Timeframe
Compatible with:
- M1
- M5
- M15
- M30
- H1
- H4
- Daily
- Weekly
Momentum Confirmation
Divergence provides additional confirmation when combined with:
- Support and Resistance
- Trend Lines
- Moving Averages
- Price Action Strategies
- Supply and Demand Zones
Trading Advantages
Using the RSI Divergence Indicator can help traders:
✔ Spot hidden market weakness.
✔ Identify potential reversal zones.
✔ Improve trade timing.
✔ Reduce emotional trading decisions.
✔ Increase chart analysis efficiency.
✔ Enhance risk-to-reward opportunities.
✔ Confirm trend exhaustion.
✔ Detect momentum shifts early.
Who Should Use This Indicator?
This indicator is suitable for:
- Beginner Traders
- Professional Traders
- Scalpers
- Day Traders
- Swing Traders
- Position Traders
- Forex Investors
- Crypto Traders
The visual signals make it easy for beginners, while the underlying RSI divergence logic provides valuable insights for experienced traders.
No comments yet. Be the first to share your feedback.
Leave a Comment
Related Products
More Indicator tools you may like.
Session Scanner
MA Crossover