
Engulfing Pattern in Forex: How to Identify High-Quality Bullish and Bearish Engulfing Signals
Introduction: Why Is the Engulfing Pattern So Important?
The Engulfing Pattern is one of the most popular and recognizable Price Action patterns in Forex trading. It is simple to identify, but understanding what makes an engulfing candle meaningful requires much more than simply looking for one candle to completely cover another.
A qualified engulfing pattern can reveal an important change in the balance between buyers and sellers. When it appears at the right location, after a meaningful movement or retracement, it can provide valuable confirmation for a trading strategy.
For example, a bullish engulfing candle in the middle of a random sideways market does not necessarily have the same meaning as a bullish engulfing candle that appears at the end of a bearish retracement directly on a major support level.
The candle may look identical.
The context is completely different.
What Is an Engulfing Pattern?
An Engulfing Pattern normally consists of two candles.
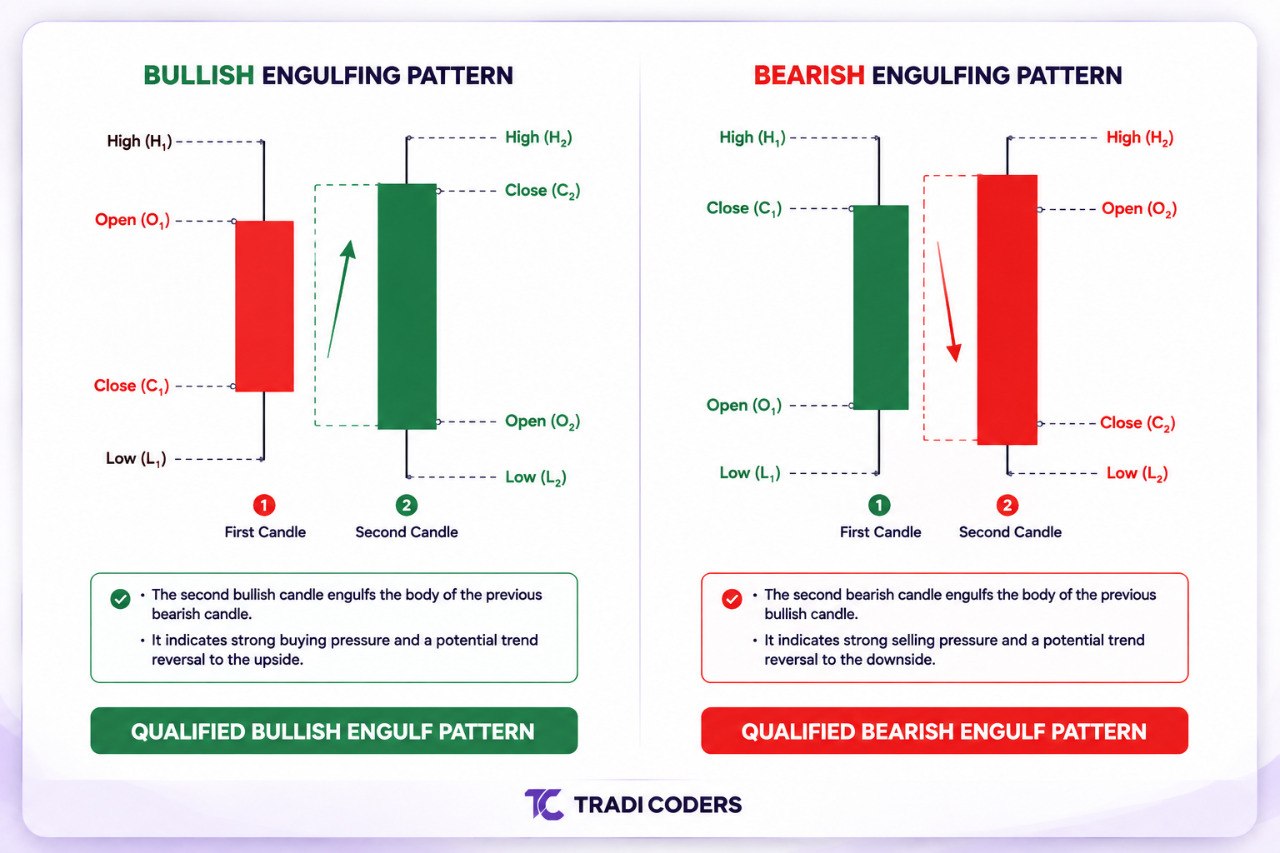
A Bullish Engulfing Pattern occurs when a bearish candle is followed by a bullish candle whose real body completely engulfs the previous candle's real body.
A Bearish Engulfing Pattern is the opposite. A bullish candle is followed by a bearish candle whose real body completely engulfs the previous candle's real body.
The important part is the body, rather than requiring the second candle to completely cover every part of the previous candle's high and low.
Bullish Engulfing
Bearish candle → Strong bullish candle → Bullish pressure increases
Bearish Engulfing
Bullish candle → Strong bearish candle → Bearish pressure increases
Engulfing at the End of Retracement
What Does an Engulfing Pattern Actually Tell Us?
The most important question is not:
"Does this candle look like an engulfing pattern?"
The better question is:
"What changed between buyers and sellers during these two candles?"
Imagine the market has been moving downward.
Sellers have controlled the market for several candles. Then a new candle opens and initially continues downward.
Suddenly, buyers enter with enough strength to push price upward and completely overcome the previous bearish candle's body.
This can indicate a significant short-term change in buying pressure.
The same logic applies in reverse to a Bearish Engulfing Pattern.
This is why engulfing candles can be useful as confirmation of a change in market pressure.
Bullish Engulfing at the End of a Downtrend
One of the most interesting situations occurs when a Bullish Engulfing Pattern appears after an extended bearish movement.
Imagine:
Lower High → Lower Low → Lower High → Lower Low → Bullish Engulfing
The market has been controlled by sellers, but suddenly buyers produce a strong bullish reaction.
This may indicate that selling pressure is weakening and buying pressure is becoming stronger.
Additional confirmation can include:
-
Break of a previous lower high.
-
Strong support level.
-
Demand zone.
-
Liquidity sweep.
-
Increased volatility.
-
Strong bullish displacement.
-
Follow-through after the engulfing candle.
The more factors that agree with the engulfing pattern, the more meaningful the signal may become.
Bearish Engulfing at the End of an Uptrend
The opposite situation occurs after an extended bullish movement.
For example:
Higher High → Higher Low → Higher High → Higher Low → Bearish Engulfing
Buyers have controlled the market, but sellers suddenly produce a strong bearish candle that overwhelms the previous bullish candle.
This can indicate that selling pressure has increased.
If the Bearish Engulfing occurs at:
-
Major resistance.
-
Supply zone.
-
Previous swing high.
-
Liquidity area.
-
End of an extended bullish movement.
then the pattern can become much more interesting.
Not All Engulfing Patterns Are Equal
One of the biggest mistakes beginners make is treating every engulfing candle as the same.
In reality, we can classify engulfing patterns according to their location, strength, and market context.
1. Trend-Reversal Engulfing
This occurs near the end of an established trend.
Example:
Downtrend → Bullish Engulfing → Possible bullish transition
or:
Uptrend → Bearish Engulfing → Possible bearish transition
2. Retracement-Ending Engulfing
This is one of the most useful applications of the Engulfing Pattern.
Imagine a market is strongly bullish:
Bullish Trend → Retracement Down → Bullish Engulfing → Continuation
Here, the engulfing pattern is not necessarily predicting a new trend.
Instead, it can indicate that the retracement may be ending and the original trend may be preparing to continue.
This is especially useful when the retracement reaches:
-
Previous resistance turned support.
-
Demand zone.
-
Fibonacci area.
-
Moving average.
-
Previous market structure.
-
Liquidity area.
This creates a very useful sequence:
Trend → Retracement → Key Level → Engulfing Confirmation → Entry
3. Breakout-Retest Engulfing
Another powerful situation occurs after a breakout.
For example:
Resistance is located at 1.1000.
Price breaks above 1.1000.
Instead of buying immediately, the trader waits for price to return to the broken resistance.
The old resistance can now act as support.
If price reaches this area and creates a Bullish Engulfing Pattern, the trader has multiple pieces of information:
Resistance Breakout + Retest + Bullish Engulfing
This is generally more informative than seeing an engulfing candle in the middle of nowhere.
4. Continuation Engulfing
An engulfing pattern can also appear during an established trend without being at the exact end of a retracement.
For example:
Uptrend → Small bearish correction → Bullish Engulfing → Continuation
The engulfing candle can indicate that buyers have regained short-term control.
The same principle applies to bearish trends.
5. Weak or Low-Quality Engulfing
Not every engulfing pattern deserves attention.
A weak engulfing may have:
-
Very small body.
-
Large opposing shadow.
-
Low volatility.
-
Weak momentum.
-
No meaningful support or resistance nearby.
-
No clear market structure context.
How to Identify a High-Quality Engulfing Pattern
There is no universal mathematical formula that guarantees a "perfect" engulfing candle.
However, several characteristics can help traders filter weak patterns.
1. Look at Body Size
The body of the engulfing candle should be meaningful relative to recent candles.
A large bullish body shows stronger buying pressure than a tiny bullish body that barely engulfs the previous candle.
The same principle applies to bearish engulfing candles.
2. Examine the Shadows
Shadows provide additional information.
For a bullish engulfing pattern, a relatively strong bullish body with limited upper rejection can be more convincing than a candle with a huge upper shadow.
For a bearish engulfing pattern, a strong bearish body with limited lower rejection can be more convincing.
However, shadows should never be analyzed independently.
Their meaning depends on where the candle appears.
3. Compare the Engulfing Candle With Recent Volatility
A candle that is twice the size of recent candles can indicate a meaningful increase in volatility.
For example:
Previous candles:
10 points
12 points
11 points
9 points
Engulfing candle:
30 points
4. Look at the Location
Location is one of the most important factors.
Ask:
Where did the engulfing happen?
Is it:
-
At support?
-
At resistance?
-
At a supply or demand zone?
-
At the end of a retracement?
-
After a liquidity sweep?
-
Near a previous high or low?
-
After a breakout?
-
In the middle of a range?
5. Look at Market Structure
An engulfing pattern becomes more useful when it agrees with market structure.
For example:
Bullish scenario
Bullish trend → Retracement → Higher Low area → Bullish Engulfing
This tells us the engulfing candle is supporting the existing bullish structure.
Bearish scenario
Bearish trend → Retracement → Lower High area → Bearish Engulfing
Again, the pattern is confirming the existing market structure rather than trying to predict a reversal from nowhere.
Why Higher Timeframes Are So Important
One of the best ways to improve the quality of Price Action analysis is to start with a higher timeframe.
Instead of immediately searching for engulfing patterns on a 1-minute or 5-minute chart, traders can first examine:
-
Daily.
-
4-Hour.
-
1-Hour.
The exact timeframe depends on the trader's strategy and holding period.
Higher-timeframe candles generally contain more market information because they represent a longer period of trading activity.
For example, a Bullish Engulfing Pattern on the Daily chart can be much more significant from a market-context perspective than a random engulfing candle on a 1-minute chart.
A Professional Multi-Timeframe Approach
A useful approach is:
Higher Timeframe
Identify:
-
Trend.
-
Market structure.
-
Important support/resistance.
-
Major engulfing patterns.
-
Supply and demand zones.
Lower Timeframe
Then move down to your execution timeframe and apply your own trading strategy.
For example:
H4 Bullish Engulfing → H1 Retracement → M15 Entry Confirmation
The lower timeframe should not replace the higher-timeframe analysis.
Instead, it can help refine the entry.
Engulfing Pattern at the End of a Retracement
This is one of the most important concepts in this article.
Suppose EUR/USD is in a clear bullish trend.
Price creates:
Higher High → Higher Low → Higher High
Then price begins retracing downward.
The trader does not immediately buy.
Instead, they wait for price to reach a meaningful area.
Price reaches previous resistance, which may now act as support.
Then a Bullish Engulfing Pattern appears.
Now the trader has:
Bullish Trend + Retracement + Key Level + Bullish Engulfing
The engulfing pattern acts as the final confirmation that buyers may be returning.
[IMAGE SECTION: Engulfing at the End of Retracement]
Engulfing Pattern and Volatility
Volatility is another important factor.
Before a strong movement, the market may experience relatively low volatility.
Then new buying or selling pressure enters.
Volatility increases.
A large directional candle appears.
An engulfing pattern can therefore represent more than just a candlestick formation. It can be evidence of a sudden change in the balance between buyers and sellers.
This is why combining:
Engulfing + Volatility + Market Structure
can produce a much stronger analysis than studying candle shape alone.
Advanced Tip: Do Not Enter Just Because the Candle Is Engulfing
One of the most important rules is:
Do not trade the pattern. Trade the context.
A trader should ask several questions before considering an entry:
-
What is the higher-timeframe trend?
-
Where is the nearest important support or resistance?
-
Is the market currently trending or ranging?
-
Did the engulfing happen after a retracement?
-
Is volatility increasing?
-
Is the engulfing body significantly stronger than recent candles?
-
Are the shadows showing rejection?
-
Did the candle break an important short-term structure?
-
Is there sufficient room for the trade to reach its target?
-
Does the pattern fit my existing trading strategy?
Engulfing Pattern Is a Confirmation Tool, Not a Complete Strategy
This point deserves special attention.
A Bullish Engulfing Pattern does not tell you:
-
How much to risk.
-
Where your stop loss must be.
-
Where your take profit should be.
-
Whether the market is fundamentally favorable.
-
Whether the higher timeframe agrees.
-
Whether the trade has acceptable risk-to-reward.
A professional sequence could look like:
Fundamental Context → Higher-Timeframe Structure → Key Level → Retracement → Engulfing Confirmation → Entry → Risk Management
The exact sequence depends on the trader's strategy, but the principle remains the same:
The engulfing candle provides information; the complete strategy determines what to do with that information.
Common Engulfing Pattern Mistakes
Mistake 1: Trading Every Engulfing Candle
There can be many engulfing patterns every day.
Most are not high-quality setups.
Mistake 2: Ignoring Timeframe
A trader may find a perfect engulfing pattern on M5 while H4 is strongly moving in the opposite direction.
Mistake 3: Ignoring Location
An engulfing candle in the middle of a random range is not necessarily valuable.
Mistake 4: Confusing Engulfing With Guaranteed Reversal
An engulfing pattern can fail.
No candlestick pattern guarantees a future market movement.
Mistake 5: Ignoring Risk Management
Even a high-quality setup can lose.
Position size should always be calculated according to the trader's predefined risk.
A Practical Engulfing Checklist
Before using an Engulfing Pattern as confirmation, traders can ask:
-
Is the higher-timeframe direction clear?
-
Is the pattern located at an important technical area?
-
Did it appear after a meaningful retracement?
-
Is the engulfing body strong compared with recent candles?
-
Is the shadow structure reasonable?
-
Has volatility increased?
-
Does it agree with market structure?
-
Is there enough room for the expected movement?
-
Does it fit my trading strategy?
-
Is the risk acceptable?
Final Thoughts: Learn to Read the Story Behind the Candle
The Engulfing Pattern is powerful not because two candles have a particular shape, but because the pattern can reveal a change in the short-term balance between buyers and sellers.
A Bullish Engulfing Pattern at the end of a bearish retracement can tell a very different story from a Bullish Engulfing Pattern appearing randomly inside a sideways market.
The most useful approach is therefore not:
"I found an engulfing candle, so I should trade."
Instead:
"I understand the market structure, price has reached an important area, the retracement may be ending, volatility is changing, and the engulfing pattern provides my final confirmation."
That is where Price Action becomes much more powerful.
Use higher timeframes to understand the larger market picture, move to lower timeframes to apply your own entry strategy, and always combine the Engulfing Pattern with proper risk management.
The candle is the signal.
The context is the information.
The strategy is what turns that information into a trading decision.


